


Housing market affordability is so stretched that home turnover hits a 40-year low
Want more housing market stories from Lance Lambert’s ResiClub in your inbox? Subscribe to the ResiClub newsletter. U.S. existing-home sales totaled just 4.06 million in 2024—the lowest annual level since 1995, according to the National Association of Realtors. That’s far below the 5.3 million in pre-pandemic 2019. But here’s the thing: Today’s housing market is even more constrained when you consider that the U.S. now has 76.3 million more people and 33.2 million more households than it did in 1995. To illustrate this point, ResiClub created the following chart: U.S. existing home sales adjusted for population size. (We used total household counts instead of total population counts). In January 2025, the seasonally adjusted annualized rate of U.S. existing home sales was 4.08 million. Dividing that figure by the total number of U.S. households (132.2 million) results in 3.1%. Pretty much the last time U.S. existing home sales—adjusted for population—were lower was in the early 1980s, when the average 30-year fixed mortgage rate peaked at 18.63% in October 1981. The sharp deterioration in housing affordability has constrained existing home sales across the country. Some of this is due to homebuyers pulling back from the market, but much of it stems from homeowners who would like to sell and buy something else but aren’t doing so. Giving up their lower monthly payment and interest rate—73.3% of outstanding mortgages have a rate below 5.0%—for a much higher monthly payment and rate is hard to stomach. And even if they were willing to move, many homeowners can’t qualify right now for that new mortgage at current mortgage rates and home prices. To compare with the analysis/chart above, below is the monthly seasonally adjusted annualized rate (SAAR) of U.S. existing home sales without adjusting for population. Big picture: To some degree, pent-up churn is building up in the housing market. In theory, the lock-in effect caused by the affordability deterioration and mortgage rate shock is most acute right out of the gate. However, over time, as lifestyle changes increase, incomes rise, and affordability improves, some additional turnover in the existing home market could be unlocked as “switching costs” come down.

Want more housing market stories from Lance Lambert’s ResiClub in your inbox? Subscribe to the ResiClub newsletter.
U.S. existing-home sales totaled just 4.06 million in 2024—the lowest annual level since 1995, according to the National Association of Realtors. That’s far below the 5.3 million in pre-pandemic 2019.
But here’s the thing: Today’s housing market is even more constrained when you consider that the U.S. now has 76.3 million more people and 33.2 million more households than it did in 1995.
To illustrate this point, ResiClub created the following chart: U.S. existing home sales adjusted for population size. (We used total household counts instead of total population counts).
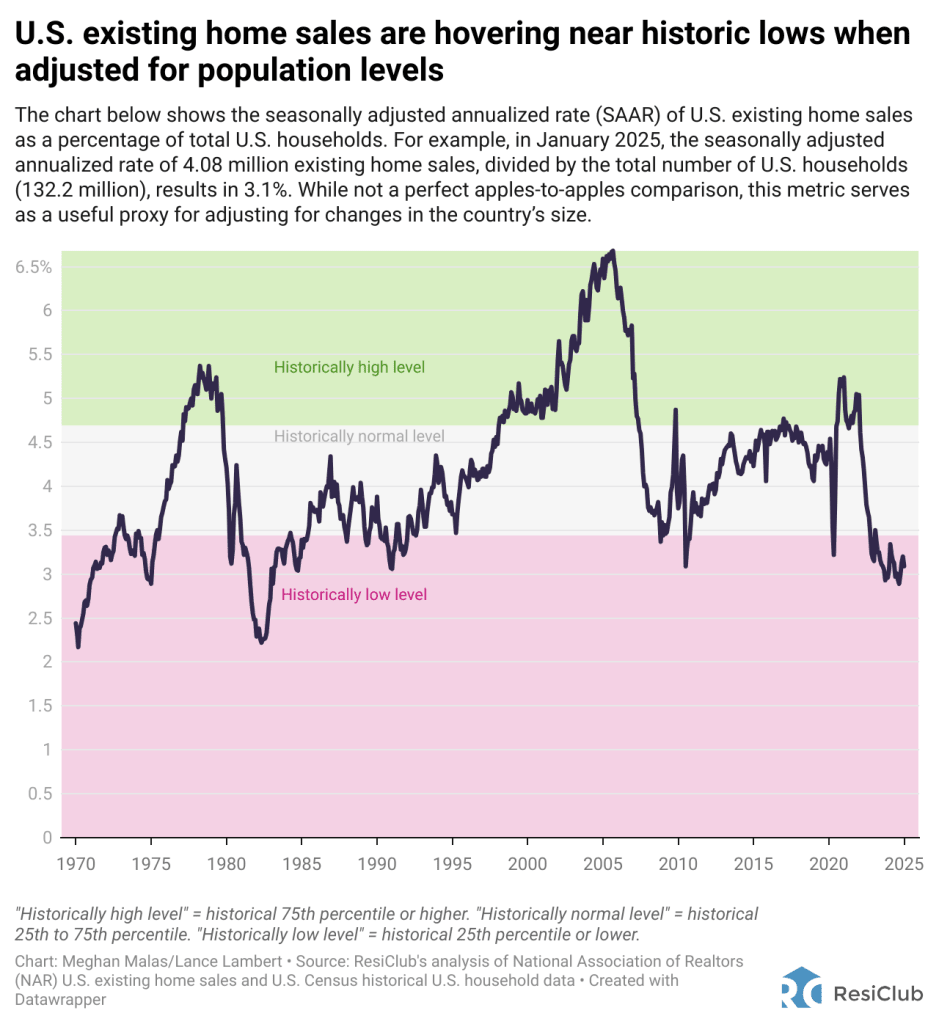
In January 2025, the seasonally adjusted annualized rate of U.S. existing home sales was 4.08 million. Dividing that figure by the total number of U.S. households (132.2 million) results in 3.1%.
Pretty much the last time U.S. existing home sales—adjusted for population—were lower was in the early 1980s, when the average 30-year fixed mortgage rate peaked at 18.63% in October 1981.
The sharp deterioration in housing affordability has constrained existing home sales across the country. Some of this is due to homebuyers pulling back from the market, but much of it stems from homeowners who would like to sell and buy something else but aren’t doing so. Giving up their lower monthly payment and interest rate—73.3% of outstanding mortgages have a rate below 5.0%—for a much higher monthly payment and rate is hard to stomach. And even if they were willing to move, many homeowners can’t qualify right now for that new mortgage at current mortgage rates and home prices.
To compare with the analysis/chart above, below is the monthly seasonally adjusted annualized rate (SAAR) of U.S. existing home sales without adjusting for population.

Big picture: To some degree, pent-up churn is building up in the housing market. In theory, the lock-in effect caused by the affordability deterioration and mortgage rate shock is most acute right out of the gate. However, over time, as lifestyle changes increase, incomes rise, and affordability improves, some additional turnover in the existing home market could be unlocked as “switching costs” come down.


![How to Find Low-Competition Keywords with Semrush [Super Easy]](https://static.semrush.com/blog/uploads/media/73/62/7362f16fb9e460b6d58ccc09b4a048b6/how-to-find-low-competition-keywords-sm.png)