


![Daredevil Born Again season 1 ending explained: does [spoiler] show up, when does season 2 come out, and more Marvel questions answered](https://cdn.mos.cms.futurecdn.net/i8Lf25QWuSoxWKGxWMLaaA.jpg?#)


.jpg)


XRP's 'Rising Wedge' Pattern Signals Price Plunge: Technical Analysis
The breakdown suggests the attempted recovery from the April 7 lows has likely ended.

Payments-focused XRP's immediate prospects look bleak, with its price chart flashing a "rising wedge" breakdown.
A rising wedge comprises two converging trendlines that connect higher lows and higher highs. This convergence suggests that upward momentum is weakening. When the price moves below the lower trendline, it signals a shift to a bearish trend.
XRP dived out of its rising wedge pattern during Wednesday's early Asian hours, suggesting that the attempted recovery from the April 7 lows near $1.60 has likely lost momentum, allowing sellers to regain control.
According to technical analysis theory, analysts should identify the starting point of the rising wedge as the initial support level following the breakdown, which means XRP can now fall back to $1.60. The cryptocurrency has also fallen below the Ichimoku Cloud, a momentum indicator, on the hourly chart, reinforcing the bearish outlook indicated by the rising wedge breakdown.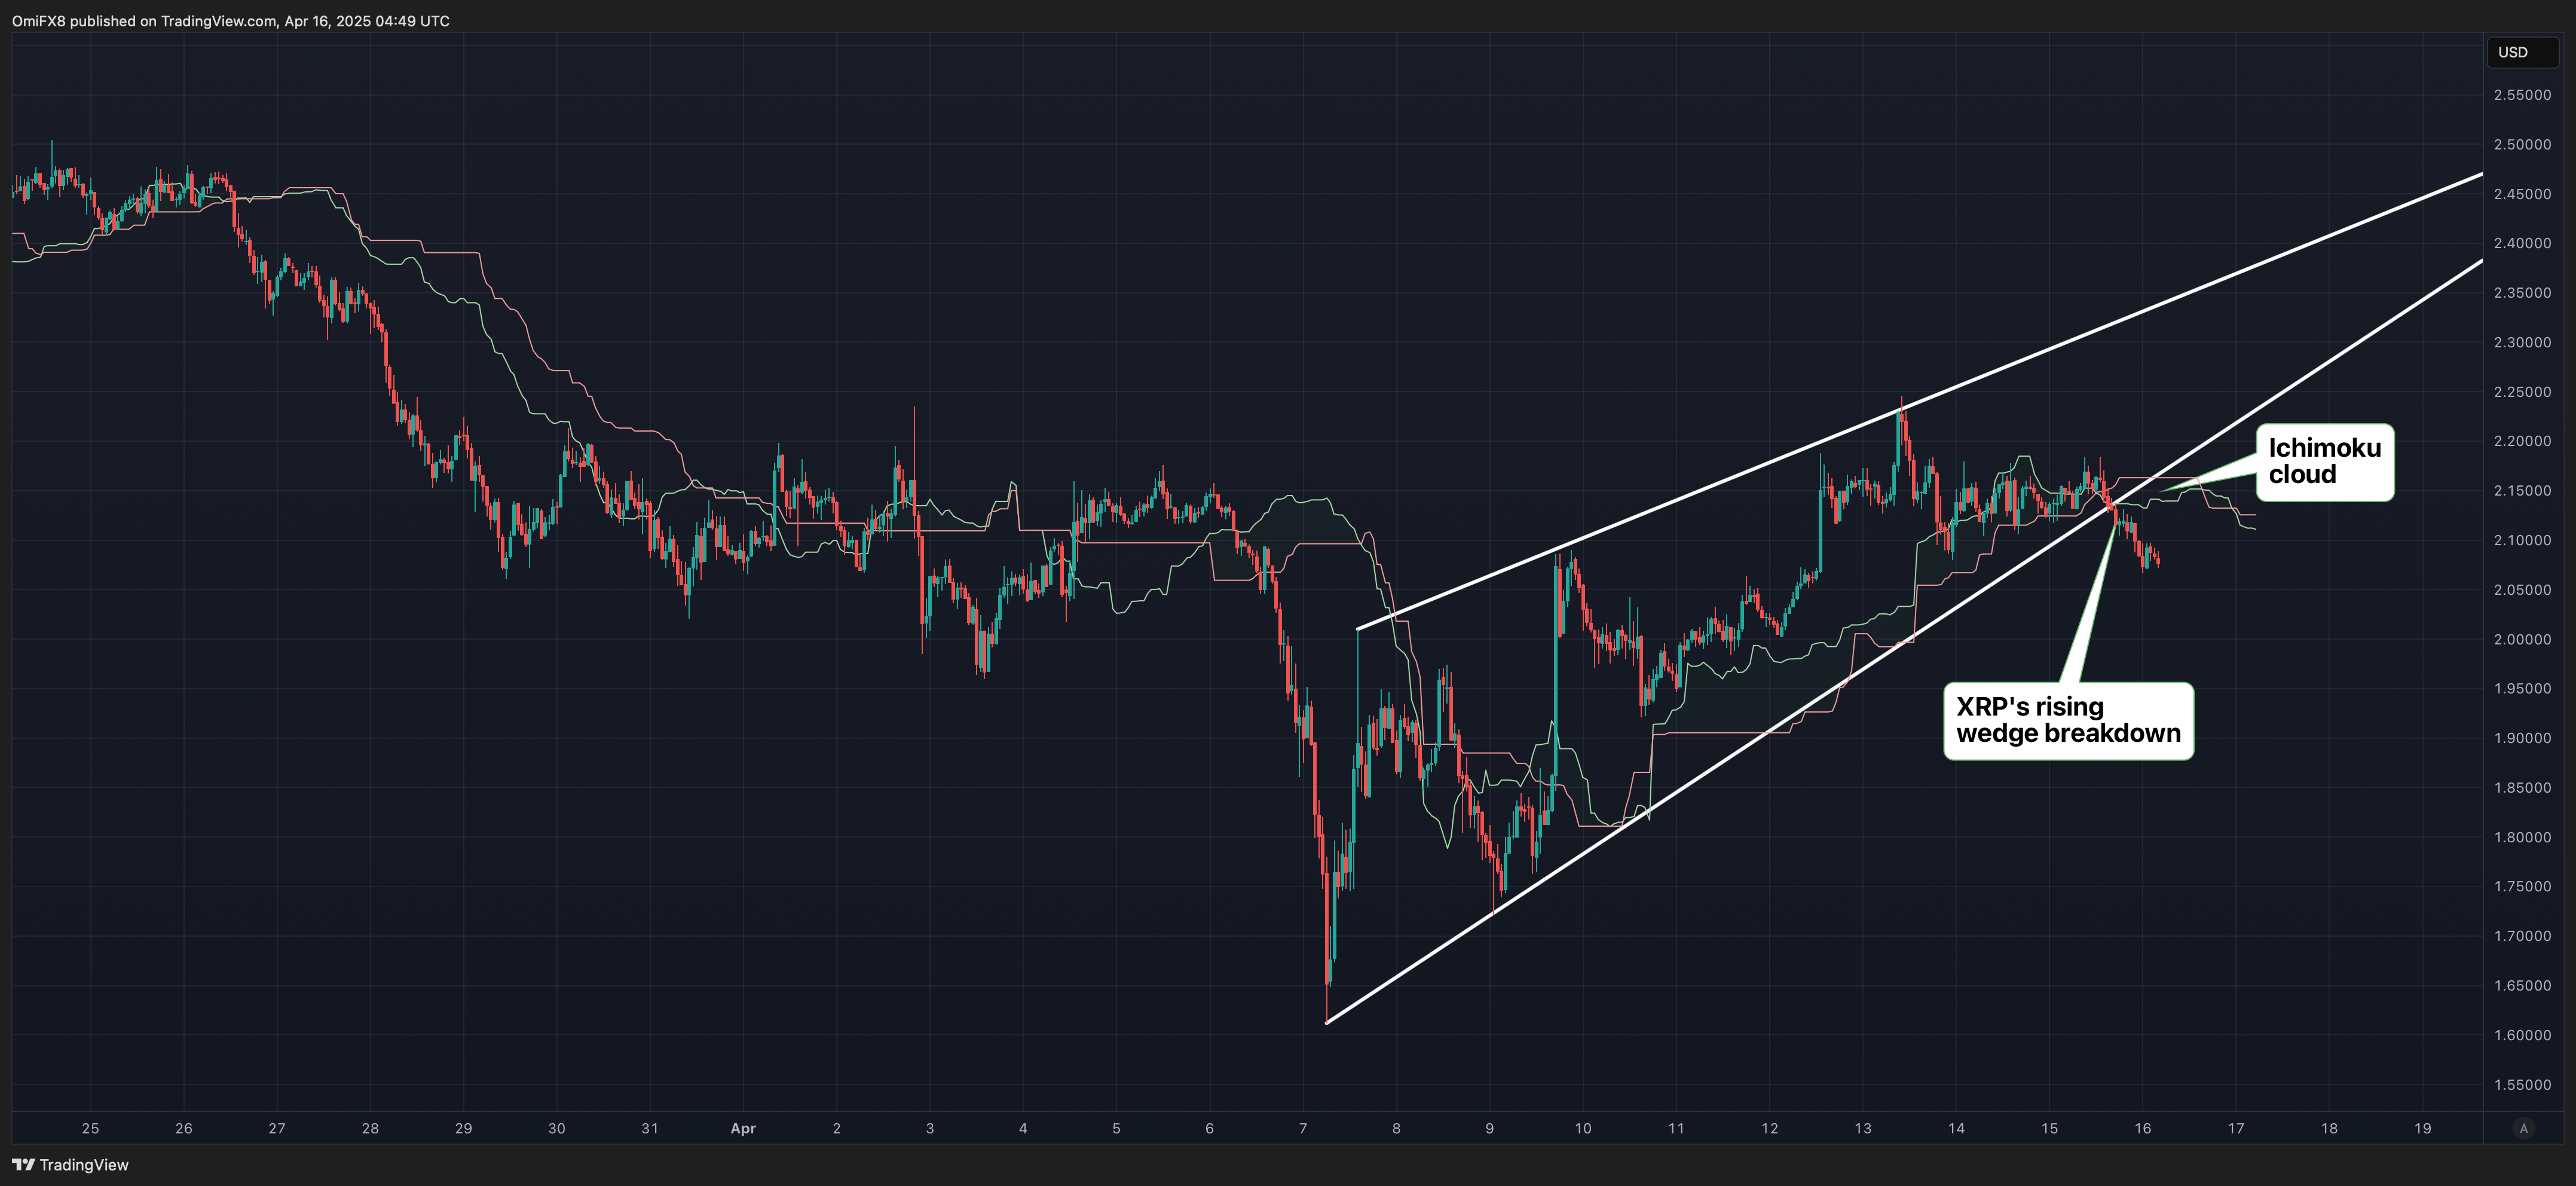
Tuesday's high of $2.18 is the level for bulls to beat to invalidate the bearish outlook.


![How to Find Low-Competition Keywords with Semrush [Super Easy]](https://static.semrush.com/blog/uploads/media/73/62/7362f16fb9e460b6d58ccc09b4a048b6/how-to-find-low-competition-keywords-sm.png)