


![How To Align the SEO Process With AI Discovery [Infographic]](https://imgproxy.divecdn.com/9P2R5ZZoepHyBzf0CW-n2EgWRhr-_OdwsznROe_GvnM/g:ce/rs:fit:770:435/Z3M6Ly9kaXZlc2l0ZS1zdG9yYWdlL2RpdmVpbWFnZS9haV9zZWFyY2hfaW5mbzIucG5n.webp)


Buyer’s or seller’s housing market? Zillow’s analysis for 250 markets
Want more housing market stories from Lance Lambert’s ResiClub in your inbox? Subscribe to the ResiClub newsletter. Zillow economists use an economic model known as the Zillow Market Heat Index to gauge the competitiveness of housing markets across the country. This model looks at key indicators—including home price changes, inventory levels, and days on market—to generate a score showing whether a housing market favors sellers or buyers. Higher scores point to hotter, seller-friendly metro housing markets. Lower scores signal cooler markets where buyers hold more negotiating power. According to Zillow, a score of 70 or above means it’s a “strong sellers market,” and a score from 55 to 69 is “sellers market.” A score from 44 to 55 indicates a “neutral market.” Meanwhile, a score from 28 to 44 is a “buyers market” and 27 or below is a “strong buyers market.” Nationally, Zillow rates the U.S. housing market at 55 in its February 2025 reading, published in March 2025. That said, Zillow’s reading varies significantly across the county. Among the 250 largest metro area housing markets, these 10 are the hottest markets, where sellers have the most power: Rochester, NY: 185 rating Buffalo, NY: 128 Syracuse, NY: 102 Hartford, CT: 99 Charleston, WV: 97 Albany, NY: 95 Manchester, NH: 92 Ann Arbor, MI: 92 Poughkeepsie, NY: 91 Boston, MA: 89 And these are the 10 coldest markets, where buyers have the most power: Jackson, TN: 16 rating Gulfport, MS: 24 Brownsville, TX: 26 Macon, GA: 26 Daphne, AL: 27 Beaumont, TX: 28 Naples, FL: 28 Cape Coral, FL: 30 Panama City, FL: 30 Punta Gorda, FL: 32 Directionally, I believe Zillow has correctly identified many regional housing markets where buyers have gained the most power—particularly around the Gulf—as well as markets where sellers have maintained (relatively speaking) somewhat of a grip, including large portions of the Northeast and Midwest. Based on my personal housing analysis, I consider Southwest Florida the weakest/softest chunk of the U.S. housing market, followed by Texas markets around Austin and San Antonio. What did this Zillow analysis look like back in spring 2022 at the climax of the pandemic housing boom? Below is Zillow’s March 2022 reading—published in April 2022.

Want more housing market stories from Lance Lambert’s ResiClub in your inbox? Subscribe to the ResiClub newsletter.
Zillow economists use an economic model known as the Zillow Market Heat Index to gauge the competitiveness of housing markets across the country. This model looks at key indicators—including home price changes, inventory levels, and days on market—to generate a score showing whether a housing market favors sellers or buyers.
Higher scores point to hotter, seller-friendly metro housing markets. Lower scores signal cooler markets where buyers hold more negotiating power.
According to Zillow, a score of 70 or above means it’s a “strong sellers market,” and a score from 55 to 69 is “sellers market.” A score from 44 to 55 indicates a “neutral market.” Meanwhile, a score from 28 to 44 is a “buyers market” and 27 or below is a “strong buyers market.”
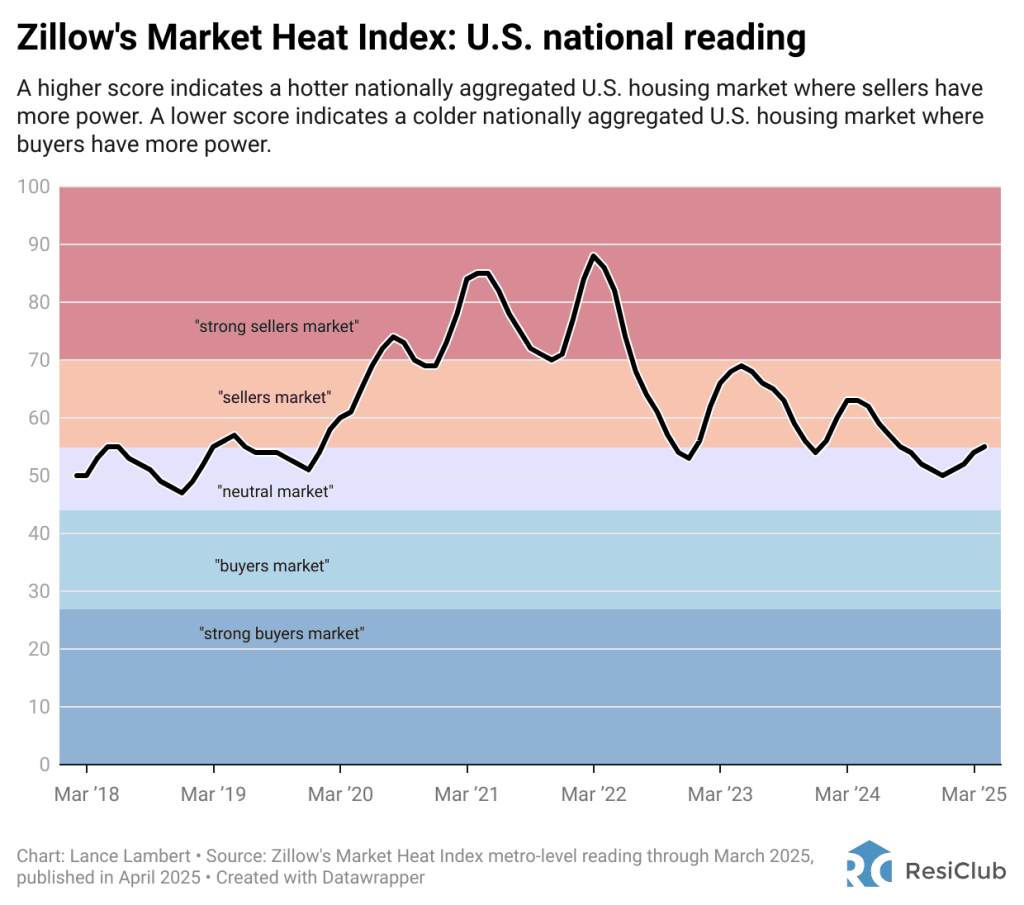
Nationally, Zillow rates the U.S. housing market at 55 in its February 2025 reading, published in March 2025.
That said, Zillow’s reading varies significantly across the county.
Among the 250 largest metro area housing markets, these 10 are the hottest markets, where sellers have the most power:
- Rochester, NY: 185 rating
- Buffalo, NY: 128
- Syracuse, NY: 102
- Hartford, CT: 99
- Charleston, WV: 97
- Albany, NY: 95
- Manchester, NH: 92
- Ann Arbor, MI: 92
- Poughkeepsie, NY: 91
- Boston, MA: 89
And these are the 10 coldest markets, where buyers have the most power:
- Jackson, TN: 16 rating
- Gulfport, MS: 24
- Brownsville, TX: 26
- Macon, GA: 26
- Daphne, AL: 27
- Beaumont, TX: 28
- Naples, FL: 28
- Cape Coral, FL: 30
- Panama City, FL: 30
- Punta Gorda, FL: 32
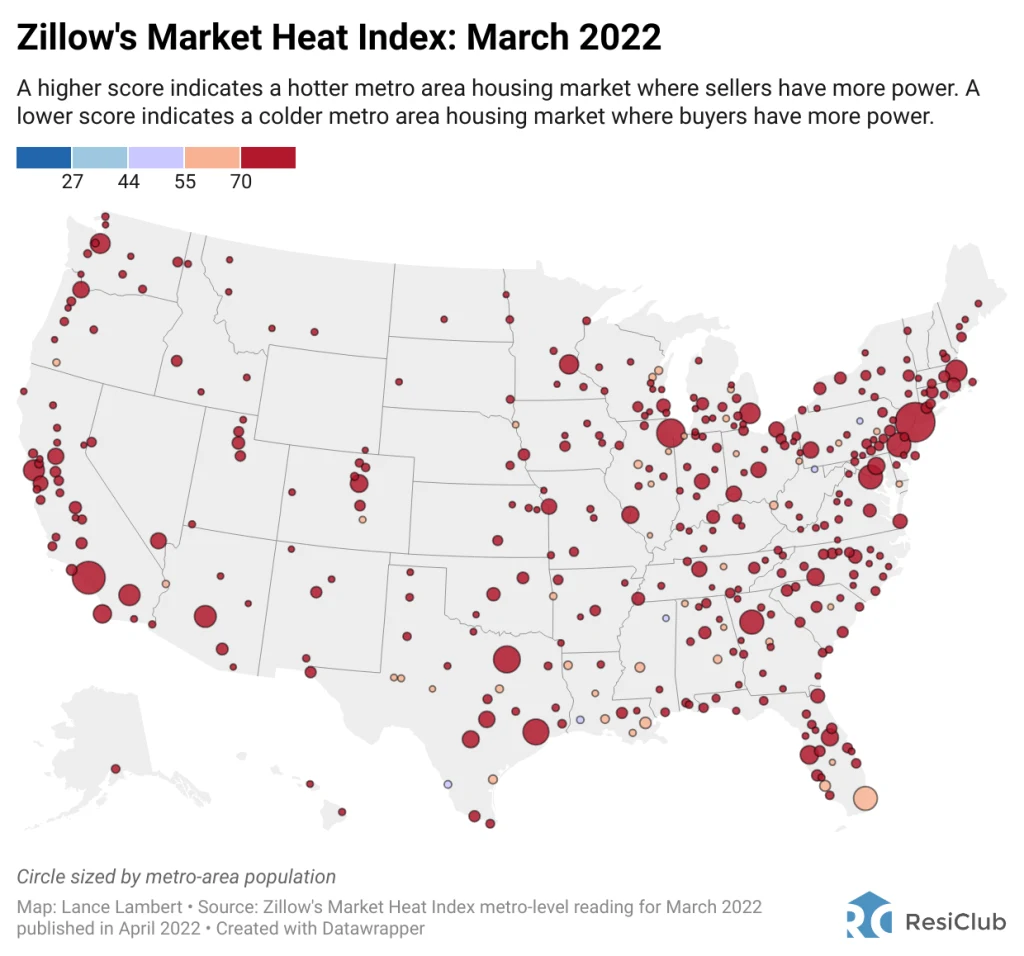
Directionally, I believe Zillow has correctly identified many regional housing markets where buyers have gained the most power—particularly around the Gulf—as well as markets where sellers have maintained (relatively speaking) somewhat of a grip, including large portions of the Northeast and Midwest.
Based on my personal housing analysis, I consider Southwest Florida the weakest/softest chunk of the U.S. housing market, followed by Texas markets around Austin and San Antonio.
What did this Zillow analysis look like back in spring 2022 at the climax of the pandemic housing boom? Below is Zillow’s March 2022 reading—published in April 2022.