


![[Weekly funding roundup May 3-9] VC inflow into Indian startups touches new high](https://images.yourstory.com/cs/2/220356402d6d11e9aa979329348d4c3e/WeeklyFundingRoundupNewLogo1-1739546168054.jpg)


-Reviewer-Photo-SOURCE-Julian-Chokkattu-(no-border).jpg)


Bitcoin eyes sub-$100K liquidity — Watch these BTC price levels next
Key points:Bitcoin (BTC) is at its highest levels since January, and traders are eyeing key levels to watch for what’s next.After hitting $104,000, BTC/USD is retracing to establish support, but the fate of $100,000 is among the concerns for market participants.Current price action represents an important battleground, as measured from the $75,000 lows this year.” Headline driven” BTC price gains draw scrutinyJust $6,000 from new all-time highs, per data from Cointelegraph Markets Pro and TradingView, BTC price action has stunned the market by jumping 10% in days.The pace of the BTC price gains has come as a surprise for many, but longer-term perspectives show where the most difficult battleground lies.“Since this current impulse was primarily headline driven again this puts markets into a crucial & critical trading day,” trader Skew said about the impetus for the move in an X post on May 8.Skew refers to a common theme uniting BTC price volatility in recent weeks and months. Bitcoin and risk assets have become highly sensitive to headlines and even social media posts involving US President Donald Trump and his trade tariffs.The latest event involves a trade deal between the US and UK, but how long optimism endures remains an open bet.“I’m sure markets are hoping this has a kick on effect to get trade deals on the table for other major trade parties like EU & China,” Skew continued.Another X post said what is needed now are “passive flows,” strong volume to support newly revisited levels and turn them into strong support.Skew added:“Passive flows will be important for accepting higher value especially after such a large market bid which led price to break $100K.”BTC/USD 1-hour chart. Source: Cointelegraph/TradingViewFibonacci levels spotlight crucial bull market battleCurrent local highs for BTC/USD have breached the $104,000 mark, and zooming out, Fibonacci retracement analysis reveals that price is now in a key zone.“$BTC is at the last technical level to clear before new ATHs,” commentator Patric H. announced in an X post. “Bitcoin has already decisively cleared the 1.618 FIB and is now trading at the volume-area high (VAH) + a weak resistance trendline.”BTC/USDT 1-day chart with Fibonacci levels. Source: Patric H./XAn accompanying chart offered important Fibonacci levels as measured from Bitcoin’s local lows around $75,000.Another trading account, Kingpin Crypto, revealed a conspicuous breakout attempt for the 1.618 Fibonacci level on the monthly chart.“Rejection and pullback from 1.618 lasted a bit longer till May. However, can’t deny how beautifully the fib level played out,” it said.BTC/USDT 1-month chart with Fibonacci levels. Source: Kingpin Crypto/XLiquidations waiting in the wingsA cautionary note involved order book liquidity at current levels.Related: How high can Bitcoin price go?The latest data from monitoring resource CoinGlass showed price eating away at bids immediately below $103,000, with the bulk of interest clustered below $100,000.To the upside, however, little friction remained, with the bulk of liquidations having already occurred on the return to six figures.Bitcoin liquidation heatmap (screenshot). Source: CoinGlass“There’s much less short liquidity clustered above,” trader TheKingfisher confirmed on X. “This notable imbalance makes the downside liquidation zone a potential key area to watch for volatility or price attraction.”Bitcoin exchange order book liquidity data. Source: TheKingfisher/XThis article does not contain investment advice or recommendations. Every investment and trading move involves risk, and readers should conduct their own research when making a decision.


Key points:
Bitcoin (BTC) is at its highest levels since January, and traders are eyeing key levels to watch for what’s next.
After hitting $104,000, BTC/USD is retracing to establish support, but the fate of $100,000 is among the concerns for market participants.
Current price action represents an important battleground, as measured from the $75,000 lows this year.
” Headline driven” BTC price gains draw scrutiny
Just $6,000 from new all-time highs, per data from Cointelegraph Markets Pro and TradingView, BTC price action has stunned the market by jumping 10% in days.
The pace of the BTC price gains has come as a surprise for many, but longer-term perspectives show where the most difficult battleground lies.
“Since this current impulse was primarily headline driven again this puts markets into a crucial & critical trading day,” trader Skew said about the impetus for the move in an X post on May 8.
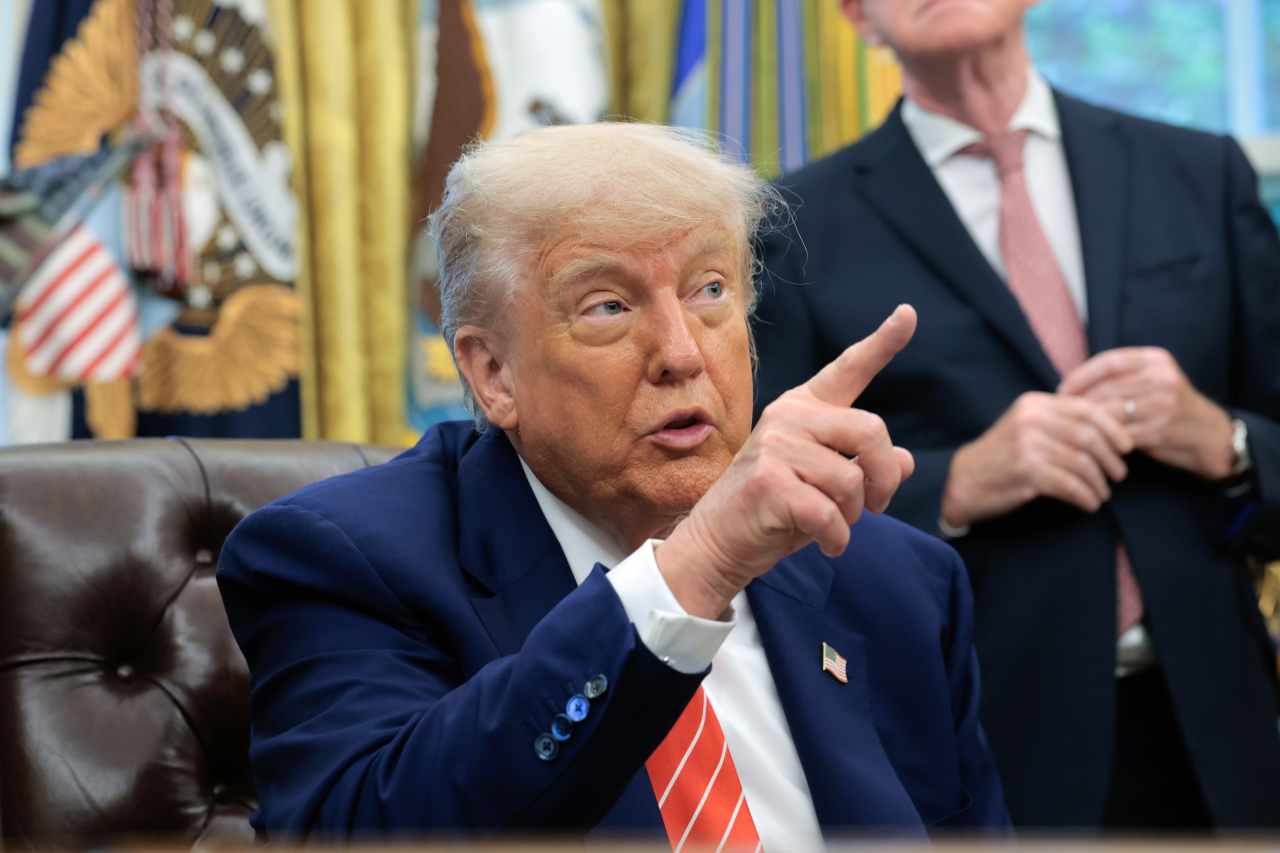
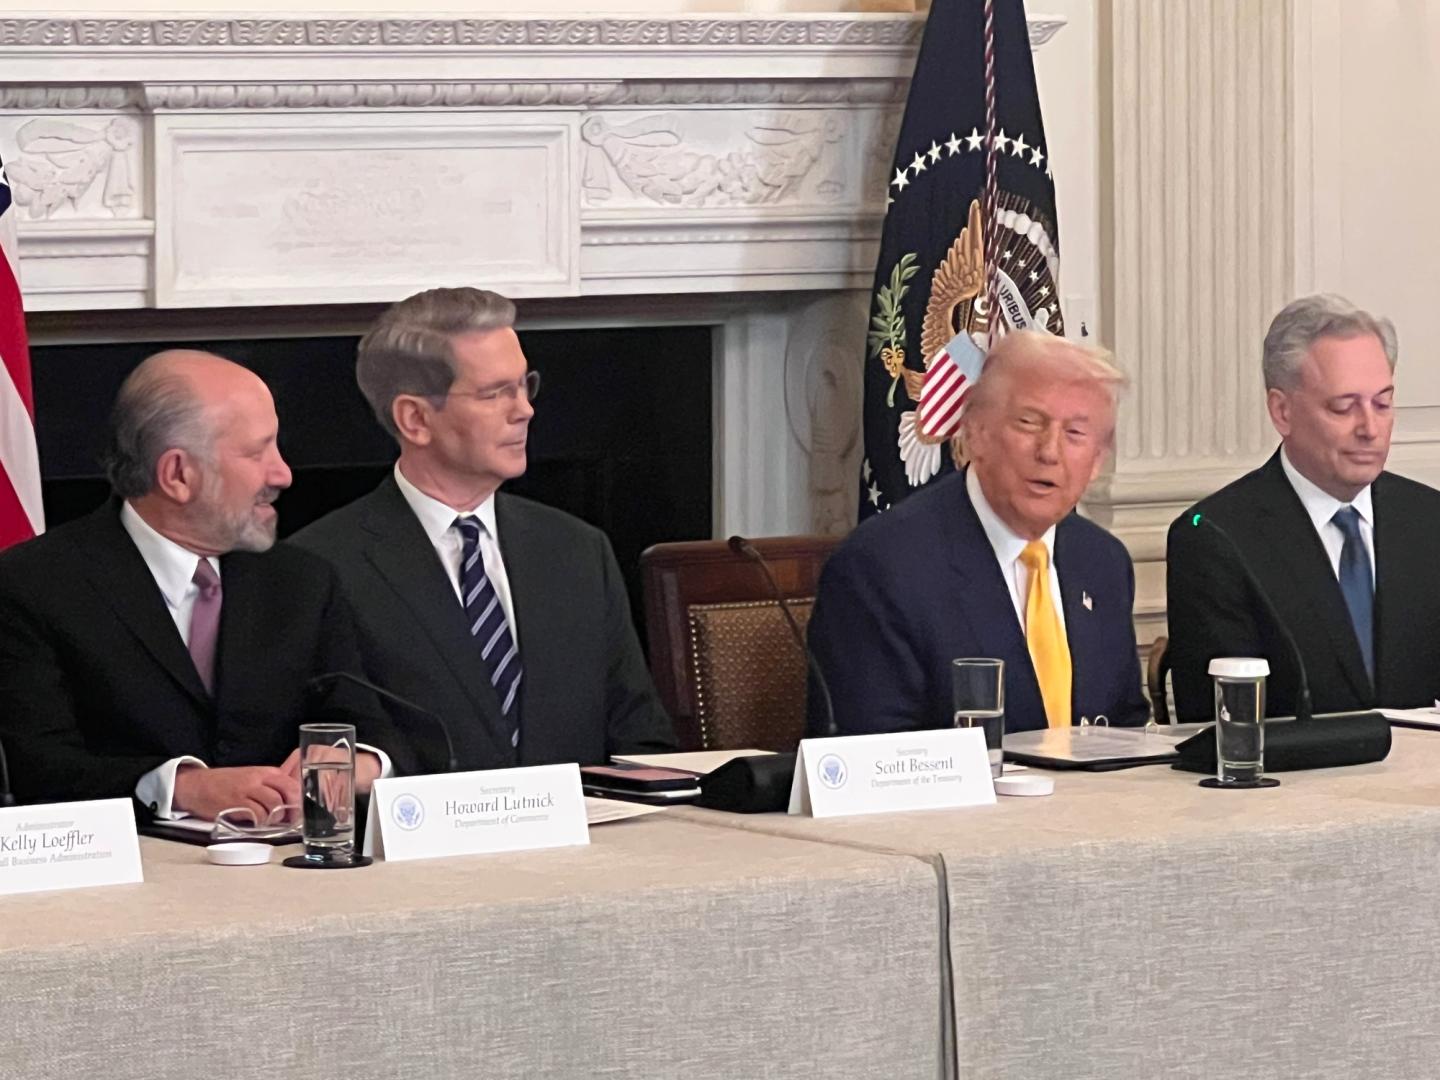
Skew refers to a common theme uniting BTC price volatility in recent weeks and months. Bitcoin and risk assets have become highly sensitive to headlines and even social media posts involving US President Donald Trump and his trade tariffs.
The latest event involves a trade deal between the US and UK, but how long optimism endures remains an open bet.
“I’m sure markets are hoping this has a kick on effect to get trade deals on the table for other major trade parties like EU & China,” Skew continued.
Another X post said what is needed now are “passive flows,” strong volume to support newly revisited levels and turn them into strong support.
Skew added:
“Passive flows will be important for accepting higher value especially after such a large market bid which led price to break $100K.”

Fibonacci levels spotlight crucial bull market battle
Current local highs for BTC/USD have breached the $104,000 mark, and zooming out, Fibonacci retracement analysis reveals that price is now in a key zone.
“$BTC is at the last technical level to clear before new ATHs,” commentator Patric H. announced in an X post.
“Bitcoin has already decisively cleared the 1.618 FIB and is now trading at the volume-area high (VAH) + a weak resistance trendline.”

An accompanying chart offered important Fibonacci levels as measured from Bitcoin’s local lows around $75,000.
Another trading account, Kingpin Crypto, revealed a conspicuous breakout attempt for the 1.618 Fibonacci level on the monthly chart.
“Rejection and pullback from 1.618 lasted a bit longer till May. However, can’t deny how beautifully the fib level played out,” it said.

Liquidations waiting in the wings
A cautionary note involved order book liquidity at current levels.
Related: How high can Bitcoin price go?
The latest data from monitoring resource CoinGlass showed price eating away at bids immediately below $103,000, with the bulk of interest clustered below $100,000.
To the upside, however, little friction remained, with the bulk of liquidations having already occurred on the return to six figures.

“There’s much less short liquidity clustered above,” trader TheKingfisher confirmed on X.
“This notable imbalance makes the downside liquidation zone a potential key area to watch for volatility or price attraction.”

This article does not contain investment advice or recommendations. Every investment and trading move involves risk, and readers should conduct their own research when making a decision.